Case study
Weekly Sales Report Automation
Built with sample data to demonstrate the workflow.
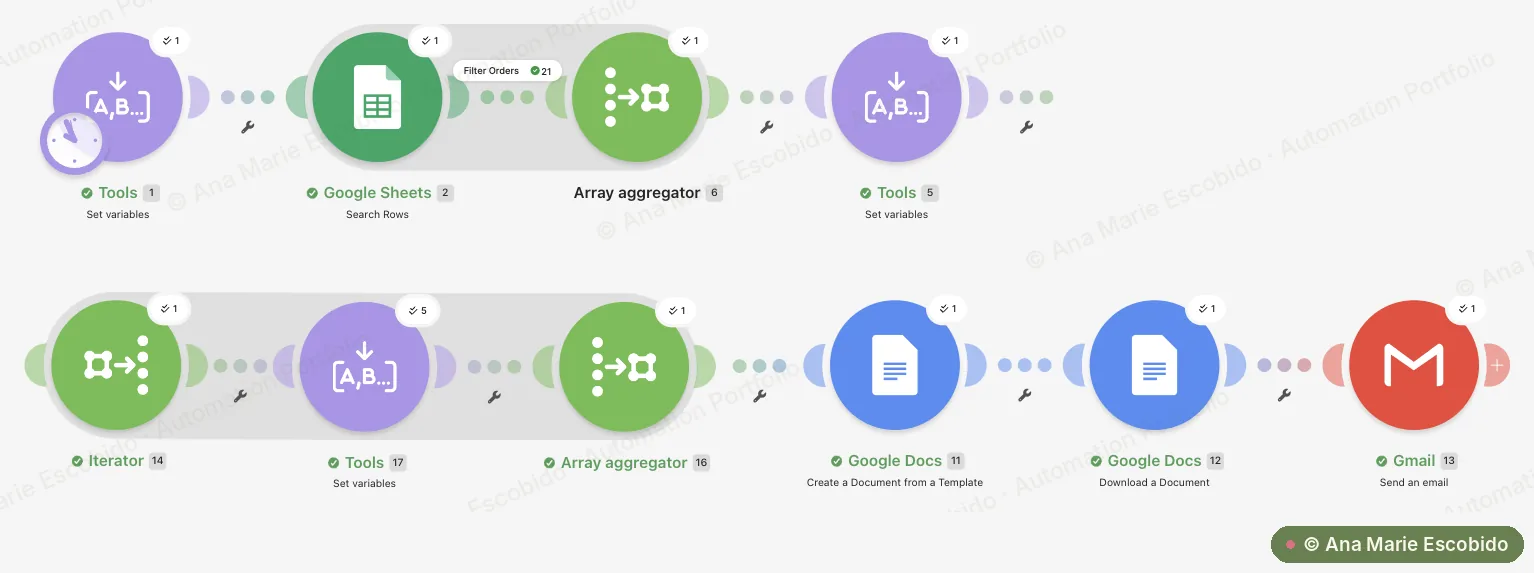
Pulls the week's paid orders from Google Sheets, totals revenue, orders and units with a per-product breakdown, fills a Google Docs report template, and emails it as a PDF.
- Automatic
- Runs without anyone building the report
- 0
- Copy-paste steps
- Report emailed with headline numbers
The Problem
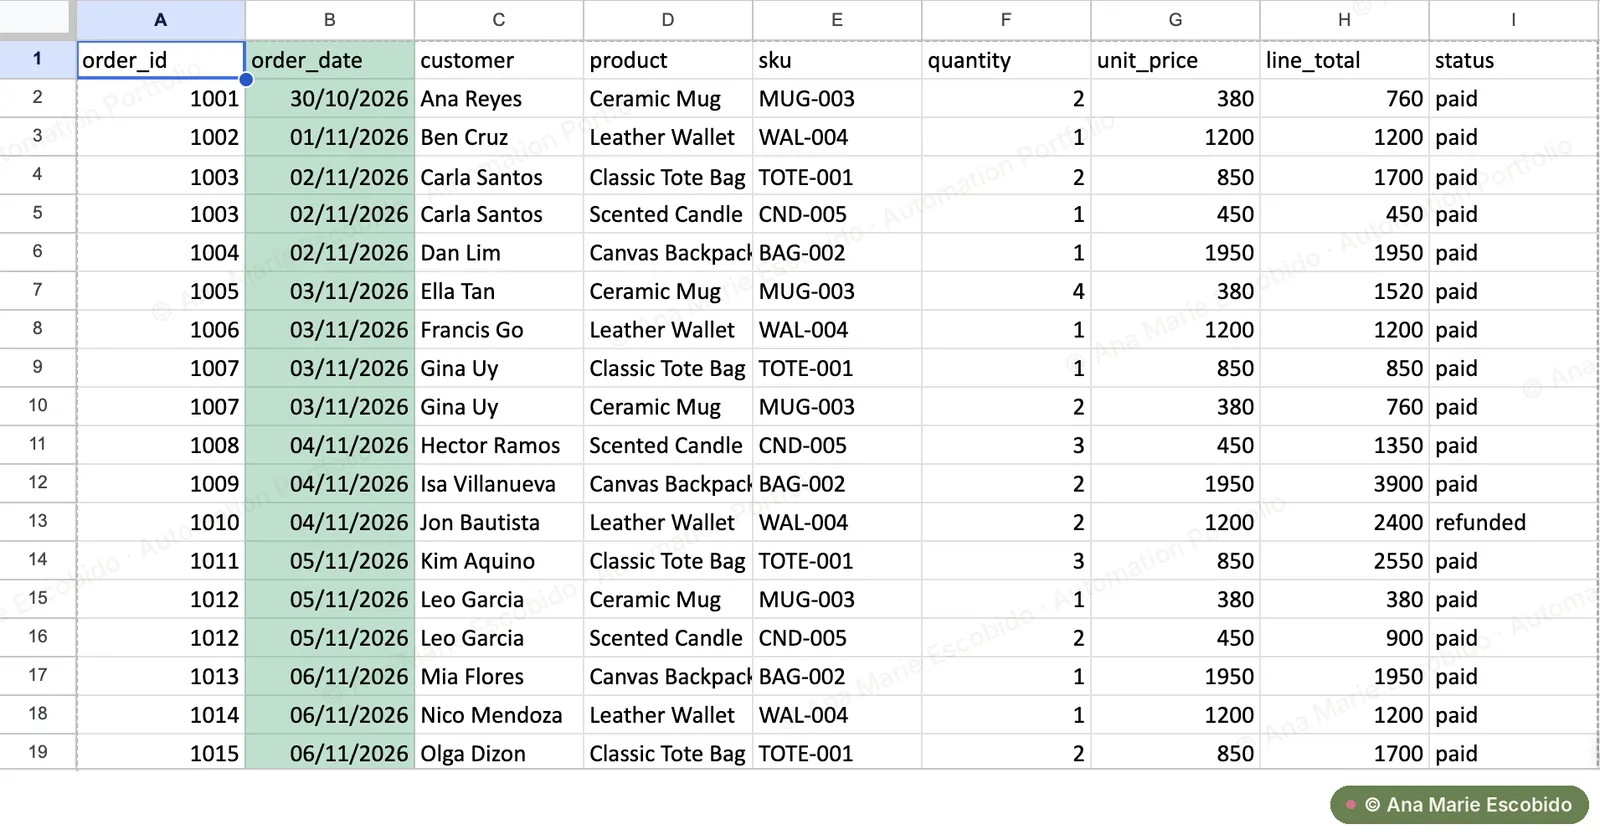
Every week, someone had to open the sales sheet, filter out unpaid orders, pick out the right dates, add up revenue, orders and units, work out each product's numbers, paste everything into a report and email it. It ate up a good part of the morning, and one copy-paste slip could put the wrong figures in front of the team.
What I Built
Pulls the week's paid orders from Google Sheets, totals revenue, orders and units with a per-product breakdown, fills a Google Docs report template, and emails it as a PDF.
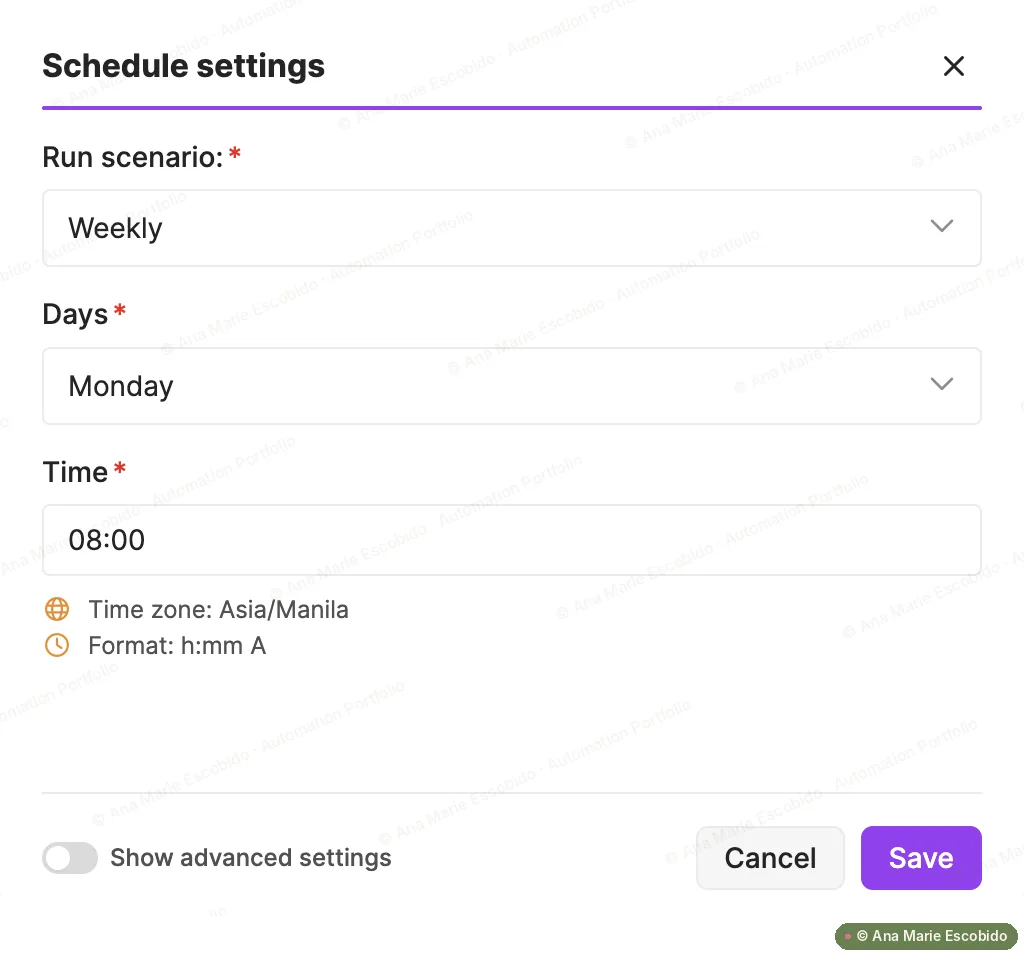
- Runs every Monday at 8:00 AM, sets the reporting week and pulls only paid orders from the sales sheet.
- Keeps orders from that week and calculates total orders, units and revenue.
- Builds a per-product breakdown of units and revenue.
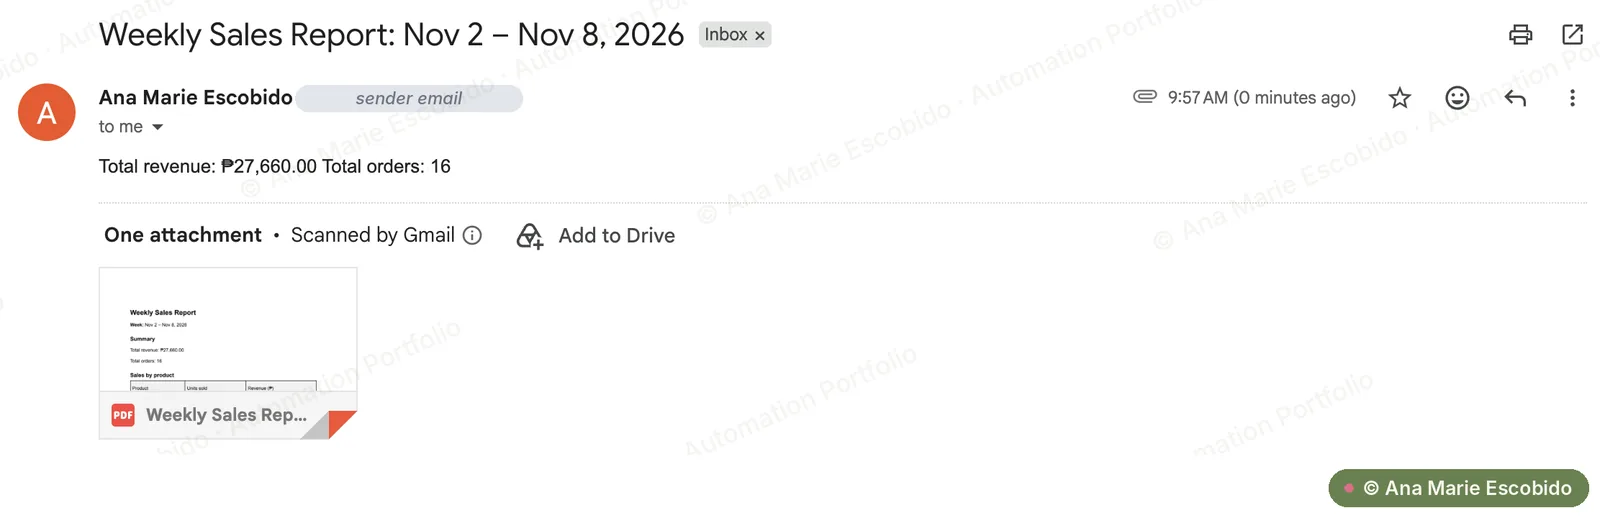
- Fills a Google Docs report template, exports it as a PDF and emails it with the headline numbers.
Interactive demo
See it work, step by step
Step 1 of 8
Set the reporting week
Every Monday at 8:00 AM (Manila time) the scenario starts on its own and works out the week to report on: a start date and an end date seven days apart.
- week_start
- Nov 2, 2026
- week_end
- Nov 9, 2026 (not included)
- Report covers
- Nov 2 – Nov 8, 2026
Walkthrough uses sample data. Names, emails and figures are illustrative.
Screenshots
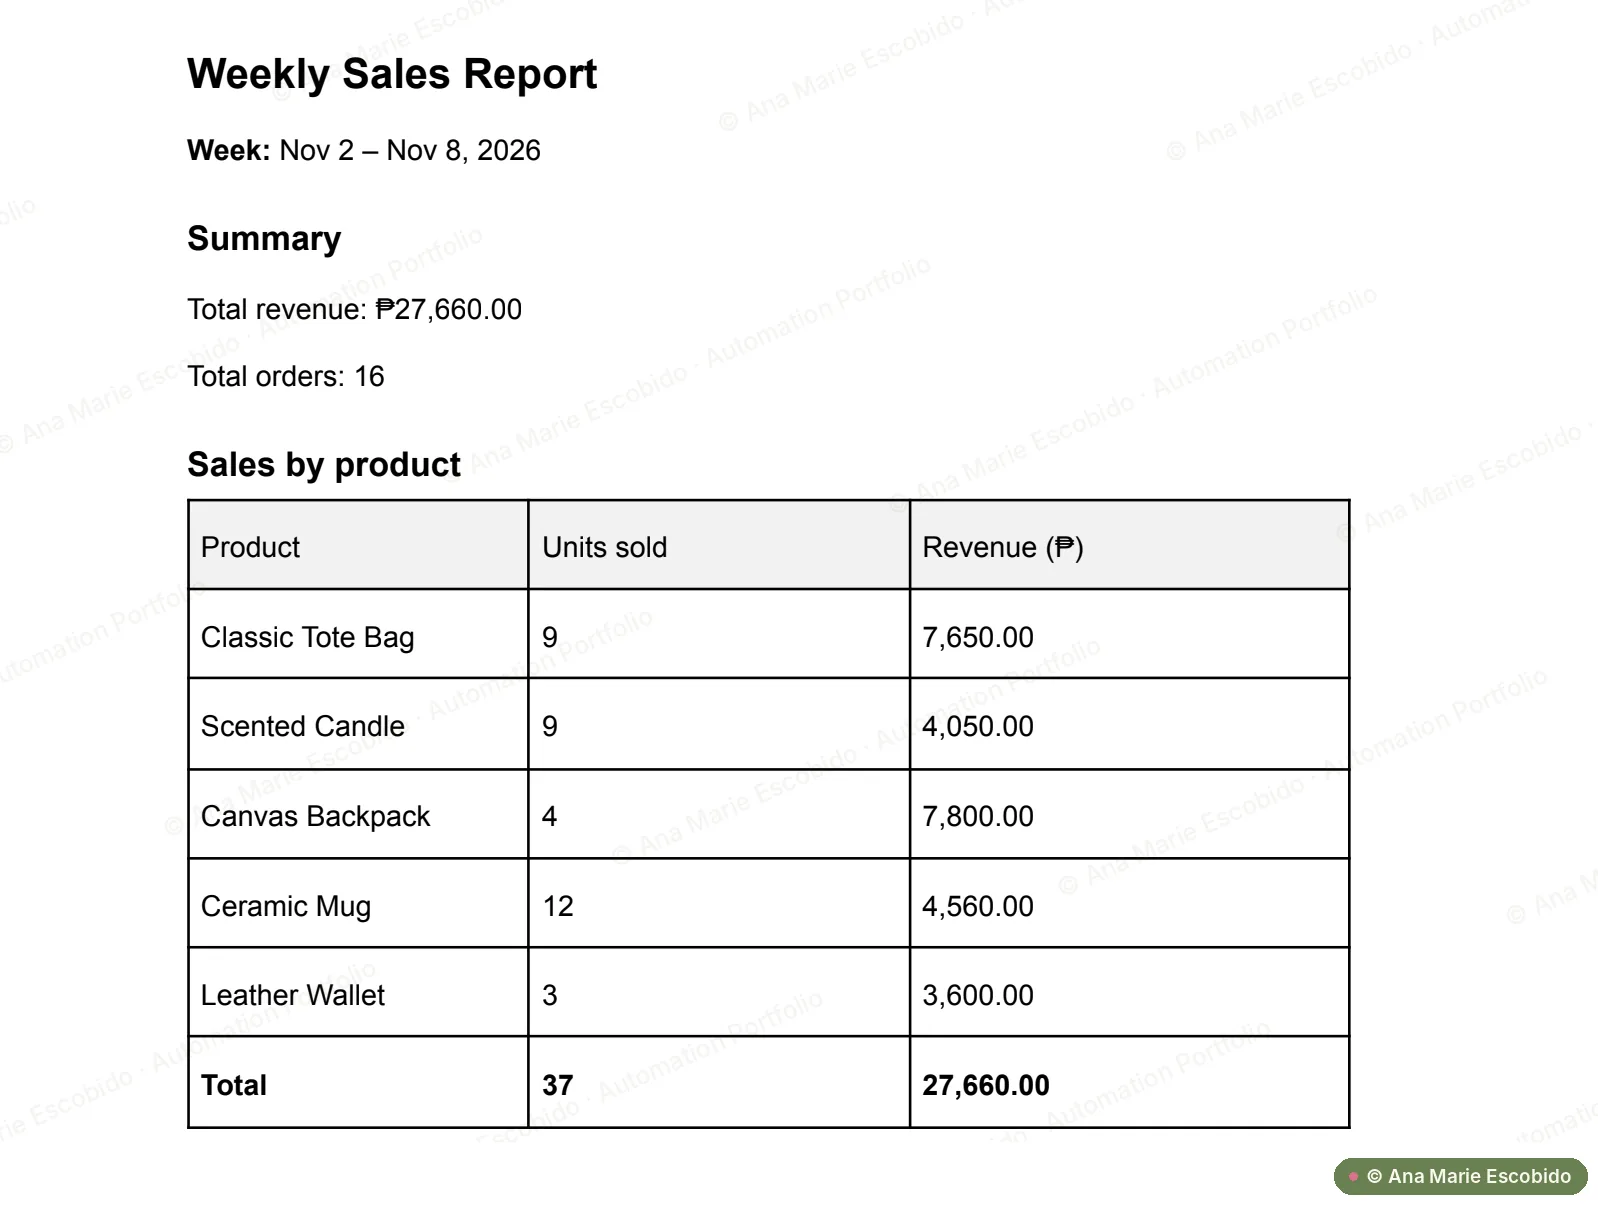
Real screenshots from a test run. Private details are hidden. Click or tap a screenshot to view it full size.
The Result
Replaces an estimated 60–90 minutes of manual reporting each week, from filtering orders to formatting and emailing the report. Because the totals are calculated the same way every time, the figures stay consistent from week to week without copy-paste errors.